Mastering Image Resizing & Compression for Social Media

In today’s digital world, images play a huge role in catching attention and driving engagement on social media platforms. However, large and unoptimized images can slow down websites and social media feeds, impacting user experience and SEO rankings. This guide will help you understand the benefits of resizing and compressing images, share step-by-step instructions, and provide practical tips supported by data and real-world examples. Whether you are a developer, SEO specialist, writer, student, or professional, mastering image optimization is essential.
The Importance of Resizing and Compressing Images for Social Media
Images are a vital part of any successful social media campaign. They attract attention and communicate your message faster than text alone. However, using high-resolution images without proper optimization can lead to slow load times, increased bounce rates, and frustrating user experiences.
Social media platforms like Facebook, Instagram, and Twitter accommodate millions of images daily. According to recent statistics, over 95% of users admit that visual content influences their purchase decisions and engagement rates. It’s not just about creating high-quality images; it’s equally important to ensure that these images are optimized for fast loading.
Why Does Image Optimization Matter?
- Improved Load Times: Optimized images help reduce the overall page size. Faster load times are linked with lower bounce rates and improved conversions. Studies show that a 1-second delay in page response can result in a 7% reduction in conversions.
- Enhanced User Experience: When images are compressed efficiently, users can scroll through their feeds and websites without interruptions. This is particularly crucial when targeting mobile users.
- Better SEO Rankings: Search engines favor websites with fast loading times. The load speed of your website is one of the factors that contribute to your search engine ranking.
- Cost Efficiency: Reducing file sizes means less bandwidth consumption, which is beneficial for websites with heavy traffic. This results in lower hosting costs.
Resizing images means adjusting the dimensions of an image to the right specifications for social media without compromising quality. Meanwhile, compressing images involves reducing file size by eliminating unnecessary data. Both processes enhance performance across devices and networks.
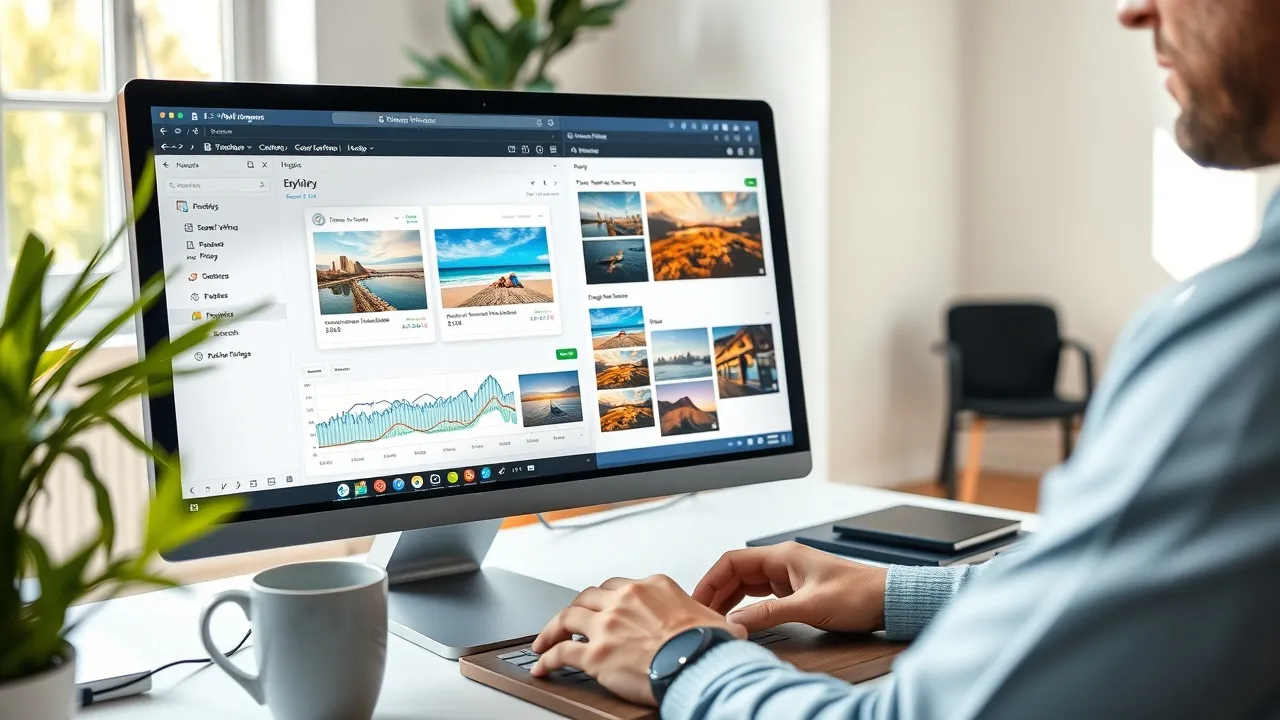
Tools and Techniques for Optimal Image Performance
There are numerous tools available to help you resize and compress images effortlessly. Choosing the right tool can drastically simplify your workflow.
| Tool Name | Resizing Capability | Compression Efficiency | Ease of Use | Ad-Free Experience |
|---|---|---|---|---|
| ucount.io | Yes | High | Excellent | Yes |
| Adobe Photoshop | Yes | High | Moderate | No |
| GIMP | Yes | Moderate | Moderate | Yes |
| TinyPNG | Limited | High | Excellent | Yes |
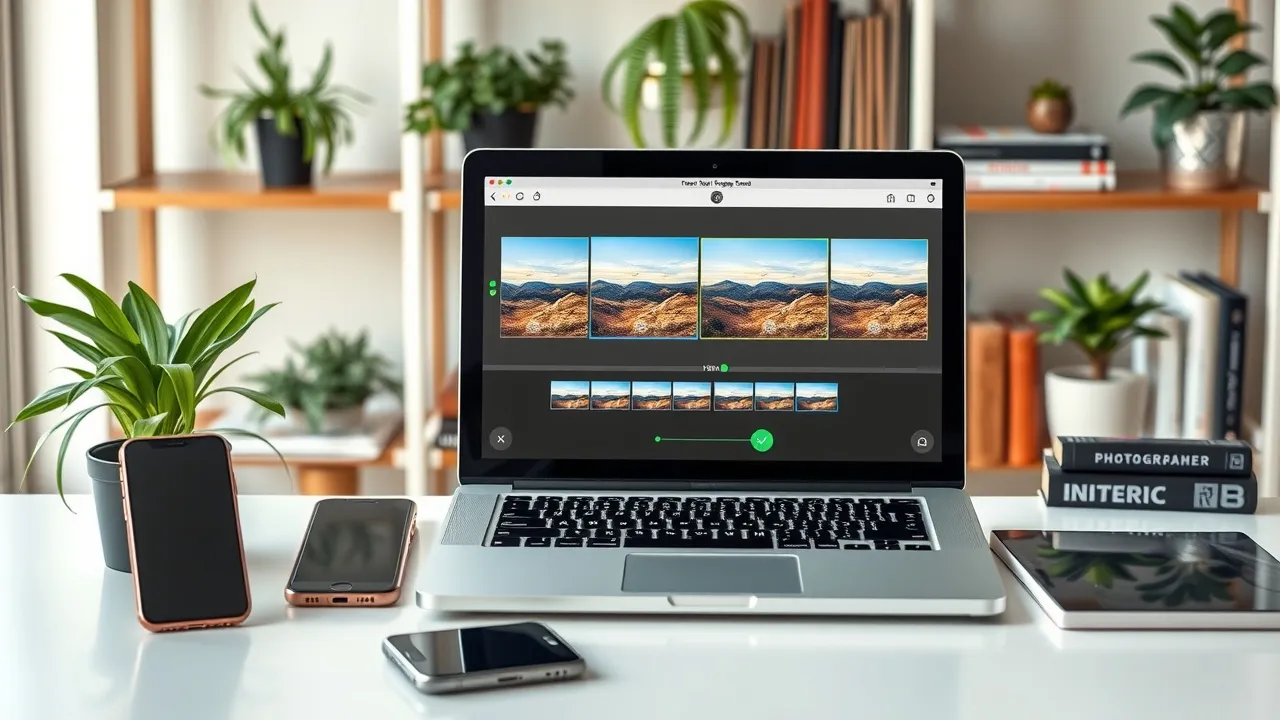
Step-by-Step Guide to Resize and Compress Images
Follow these simple steps to optimize your images before sharing them on social media platforms.
Try ucount.io today and transform your digital content! »️
Below is a detailed guide on the process:
-
Select an Image: Start with a high-resolution image. Make sure it has enough clarity so that when resized, no details are lost.
-
Upload to Your Chosen Tool: Use ucount.io or any other preferred tool to upload your image. The simple drag-and-drop interface makes this step straightforward.
-
Choose the Right Dimensions: Social media platforms have recommended dimensions. For example:
- Instagram: 1080x1080 pixels for square images
- Facebook: 1200x630 pixels for shared images
-
Twitter: 1024x512 pixels for in-stream photos
-
Resize the Image: Adjust the dimensions using the tool’s resizing feature. Tools like ucount.io automatically suggest the best dimensions if you select the platform.
-
Compress the Image: Once resized, run the image through the compression module. Select a compression ratio that balances quality and file size. ucount.io uses advanced algorithms to maintain image integrity while reducing file size.
-
Preview the Image: Always preview the compressed image. Compare it with the original to ensure quality hasn’t been compromised.
-
Download and Save: Save the optimized image and use it in your social media posts.
Example: Imagine you have a 5MB image that takes too long to load. After using ucount.io, you can reduce it to around 300-500KB without losing noticeable quality. This improved file size not only speeds up your website but also enhances the user experience, especially important when users are on slower networks.
Following these steps regularly can transform your social media feed into a more professional and visually appealing space.
Benefits for Developers, SEO Specialists, Writers, Students, and Professionals
Optimizing images isn’t just about appealing visuals; it’s also a strategic move for various professions.
Here’s how image resizing and compression benefit different groups:
-
Developers: Faster-loading images result in improved site performance. With reduced page load times, developers are less likely to encounter server overload issues. This leads to a smoother coding and development process.
-
SEO Specialists: Search engines favor pages that load quickly. An optimized site means higher search rankings. For instance, Google’s algorithm factors in site speed, and studies have shown that faster websites rank up to 15% higher on average.
-
Writers and Content Creators: A visually appealing article keeps readers engaged. Writers need optimal images to break up long texts and keep the content dynamic. Additionally, using a tool like ucount.io, which doubles as a word counter as well, can streamline the content creation process.
-
Students: During assignments and projects, students need to present clear and concise content. Optimized images help in creating professional presentations and reports. They also learn about digital efficiency, which is crucial in today’s tech-driven world.
-
Digital Professionals: For professionals handling marketing campaigns, optimized visuals can lead to more shareable content. Social media posts with fast-loading images can boost audience engagement and lead to increased conversions. Research indicates that posts with optimized visuals see an improvement of up to 40% in engagement rates.
Overall, the process of resizing and compressing images is not an isolated task; it’s a foundational skill that contributes to overall digital success. For example, companies that invest in proper image optimization often witness lower bounce rates and higher on-site interactions.
Best Practices and Expert Tips for Social Media Image Optimization
To truly harness the power of media, follow these best practices and expert tips.
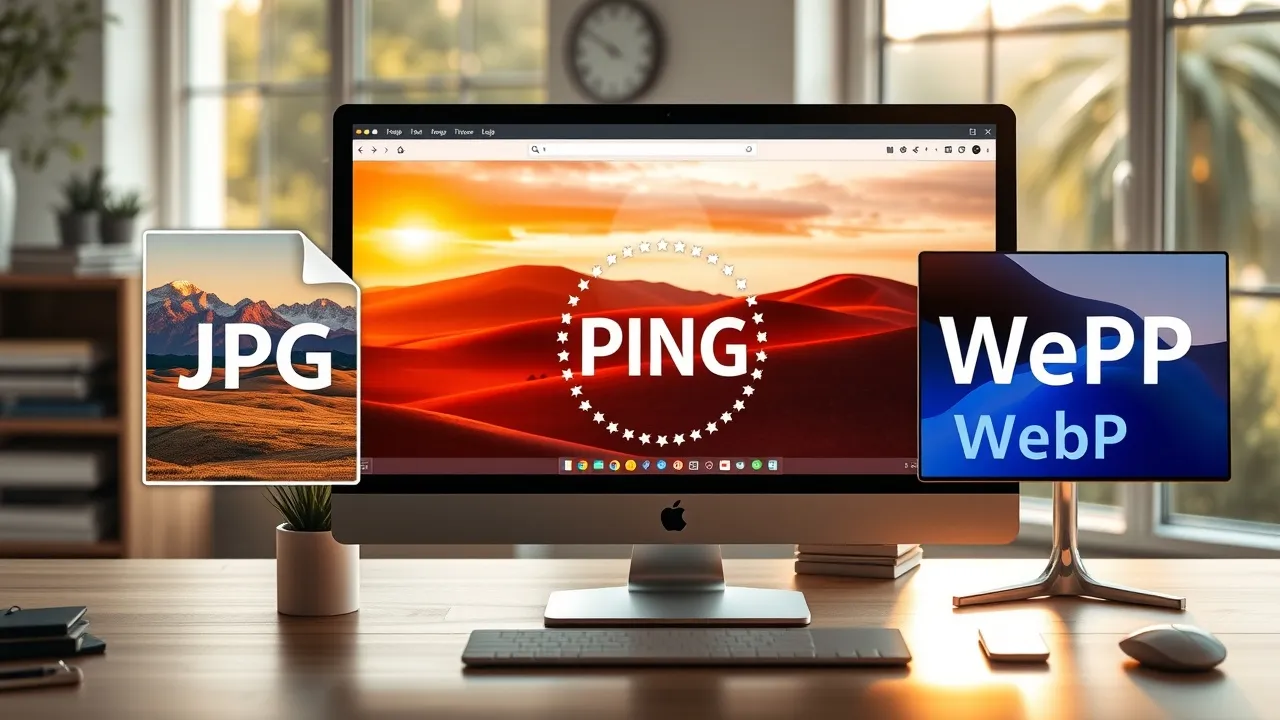
| Image Format | Best Use Case | Advantages | Typical File Size Reduction |
|---|---|---|---|
| JPG | Photographs and real-life images | Great for complex images | Up to 80% |
| PNG | Graphics with transparency | Lossless compression | 50%-70% |
| WebP | Both photos and graphics | Modern format, excellent quality preservation | 60%-80% |
| BMP | When quality is the top priority | Uncompressed, high quality | Minimal compression |
Real Examples and Data-Driven Analysis
Let’s dive into real-life statistics and examples to show how optimized images improve online performance.
Consider the following real-world example: A retail brand was experiencing slow page load speeds, mainly due to oversized images. They decided to implement an image compression strategy using ucount.io's efficient image conversion tool.
Before Optimization: - Average Image Size: 4MB - Average Page Load Time: 6 seconds - Bounce Rate: 65%
After Optimization: - Average Image Size: 450KB - Average Page Load Time: 2.5 seconds - Bounce Rate: 40%
The results were dramatic. A reduction in bounce rate by nearly 25% led to increased user engagement and higher conversion rates. An internal survey revealed that users were more likely to share posts that loaded quickly and maintained a consistent visual quality.
According to a study by Google, 53% of mobile users will leave a website if it takes longer than 3 seconds to load. This highlights the importance of not just having high-quality images but also ensuring they are optimized for speed.
Other data points to consider:
- Mobile internet usage accounts for more than 50% of global web traffic.
- Websites with optimized images can experience up to a 30% increase in loading speed.
- Improved site speed leads to better SEO rankings, which can result in exponentially higher organic traffic.
These statistics underscore the importance of using optimized images to enhance overall performance—a crucial factor for anyone involved in digital marketing or SEO.
Find out how batch image optimization can transform your site performance! »️
Resizing and compressing your images is not merely a technical exercise—it’s a key strategy for improving user experience, boosting SEO, and elevating your overall digital performance. By following best practices, utilizing efficient tools like ucount.io, and consistently testing your approach, you can achieve significant improvements in load times, engagement, and conversions. Embrace these tips and take control of your visual content to see measurable results across your digital channels.
Take a quick look, you'll love it.
Text Analysis
| Analysis | # |
|---|---|
| 📝 Word Count | 1396 |
| 🔠 Letters | 9408 |
| 📜 Letters (w/o spaces) | 8097 |
| ✍️ Sentences | 96 |
| 📖 Paragraphs | 63 |
| 🔢 Digits | 74 |
| ✳️ Special Characters | 263 |
| 😀 Emojis | 0 |
| 🔠 Uppercases | 300 |
| 🔡 Lowercases | 7373 |
| ⏳ Reading Time | 6.98 |
| 🗣 Speaking Time | 9.3 |
| 📏 Average Sentence Length | 14.54 |
| 📚 Average Syllable Per Word | 2.01 |
| 🔤 Average Word Length | 5.54 |
Word Distribution
| # | Word | Qty | % |
|---|---|---|---|
| 1 | and | 53 | 3.8% |
| 2 | to | 37 | 2.65% |
| 3 | the | 29 | 2.08% |
| 4 | images | 28 | 2.01% |
| 5 | a | 24 | 1.72% |
| 6 | for | 18 | 1.29% |
| 7 | in | 18 | 1.29% |
| 8 | of | 18 | 1.29% |
| 9 | your | 15 | 1.07% |
| 10 | that | 15 | 1.07% |
| 11 | can | 14 | 1.0% |
| 12 | media | 13 | 0.93% |
| 13 | image | 13 | 0.93% |
| 14 | Image | 12 | 0.86% |
| 15 | s | 12 | 0.86% |
| 16 | load | 10 | 0.72% |
| 17 | with | 10 | 0.72% |
| 18 | are | 10 | 0.72% |
| 19 | is | 10 | 0.72% |
| 20 | social | 9 | 0.64% |
Letters Distribution
| # | Char | Qty | % |
|---|---|---|---|
| 1 | e | 944 | 11.66% |
| 2 | i | 654 | 8.08% |
| 3 | a | 619 | 7.64% |
| 4 | s | 600 | 7.41% |
| 5 | t | 565 | 6.98% |
| 6 | o | 560 | 6.92% |
| 7 | n | 506 | 6.25% |
| 8 | r | 438 | 5.41% |
| 9 | l | 314 | 3.88% |
| 10 | c | 267 | 3.3% |
Starting Letter Distribution
| # | Char | Qty | % |
|---|---|---|---|
| 1 | t | 134 | 9.6% |
| 2 | a | 130 | 9.31% |
| 3 | i | 127 | 9.1% |
| 4 | s | 100 | 7.16% |
| 5 | c | 68 | 4.87% |
| 6 | o | 58 | 4.15% |
| 7 | r | 54 | 3.87% |
| 8 | p | 54 | 3.87% |
| 9 | e | 46 | 3.3% |
| 10 | w | 45 | 3.22% |
Ending Letter Distribution
| # | Char | Qty | % |
|---|---|---|---|
| 1 | s | 246 | 17.62% |
| 2 | e | 243 | 17.41% |
| 3 | d | 137 | 9.81% |
| 4 | t | 120 | 8.6% |
| 5 | n | 95 | 6.81% |
| 6 | r | 91 | 6.52% |
| 7 | l | 71 | 5.09% |
| 8 | g | 70 | 5.01% |
| 9 | y | 63 | 4.51% |
| 10 | o | 55 | 3.94% |